statistics: ch 2 graphical representation of data (35 of 62) test for normality: ex 1
Published 4 years ago • 1.2K plays • Length 5:23Download video MP4
Download video MP3
Similar videos
-
 3:24
3:24
statistics: ch 2 graphical representation of data (36 of 62) test for normality: ex 2
-
 3:32
3:32
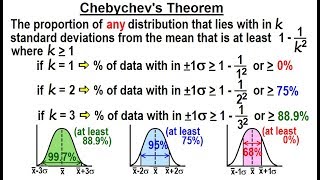
statistics: ch 2 graphical representation of data (34 of 62) chebychev's theorem
-
 6:22
6:22
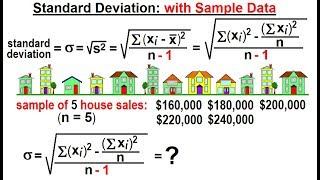
statistics: ch 2 graphical representation of data (33 of 62) standard deviation: with sample data
-
 2:47
2:47
statistics: ch 2 graphical representation of data (59 of 62) how to deceive with statistics? ex 1
-
 4:13
4:13
statistic: ch 2 graphical representation of data (43 of 62) what is the 2nd quartile?
-
 3:13
3:13
statistics: ch 2 graphical representation of data (41 of 62) how to calculate the 1st quartile: ex 3
-
 3:15
3:15
statistics: ch 2 graphical representation of data (20 of 62) midrange
-
 4:34
4:34
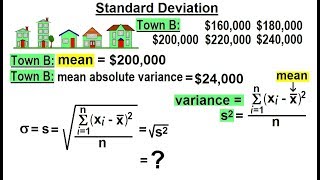
statistics: ch 2 graphical representation of data (28 of 62) what is standard deviation?
-
 6:00
6:00
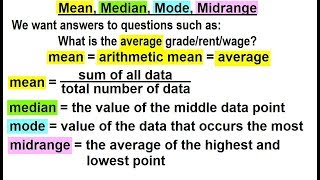
statistics: ch 2 graphical representation of data (16 of 62) mean, median, mode, midrange
-
 4:31
4:31
statistic: ch 2 graphical representation of data (42 of 62) how to calculate the 1st quartile: ex 4
-
 4:14
4:14
statistics: ch 2 graphical representation of data (46 of 62) what is percentile?
-
 1:47
1:47
statistics: ch 2 graphical representation of data (57 of 62) the upper and lower hinge
-
 3:36
3:36
statistics: ch 2 graphical representation of data (47 of 62) calculating percentile: method 1
-
 3:09
3:09
statistics: ch 2 graphical representation of data (60 of 62) how to deceive with statistics? ex. 2
-
 2:54
2:54
statistics: ch 2 graphical representation of data (24 of 62) sum of the deviation from the mean
-
 5:31
5:31
statistics: ch 2 graphical representation of data (27 of 62) variance: a closer look